 AI Charts
Introducing AI Charts
AI Charts plots published AI benchmark results, and each benchmark snapshot records its source, named version, and retrieval date.
Sourced analysis of AI model and agent benchmarks: what each evaluation measures, what the results show, and where the evidence stops. The first collection focuses on coding agents.
Explore the coding-agent chart16 sourced analysis articles
AI Charts plots published AI benchmark results, and each benchmark snapshot records its source, named version, and retrieval date.
Claude Code · Opus 5.5 (max) scores 66.0 on AA Index at $13.04 per task, first of 20 configurations and the costliest row. The next frontier point down gives up 3.8 points for 95% of the cost.

Claude Opus 5.5 at max effort scores 57.6 on the Intelligence Index at $5.98 per task, first of 97 configurations. The four highest points on the cost frontier are all its effort levels.

Codex · GPT-6 Sol (max) scores 56.7 on the coding-agent AA Index at $2.99 per task, seventh of 20 configurations, and GPT-6 Sol (max) scores 47.5 on the Intelligence Index at $1.06 per task. Each row sits on its own chart’s cost frontier.

On the September 25, 2026 snapshots, Grok Build · Grok 4.7 (xhigh) scores 56 on the coding-agent AA Index and Grok 4.7 (xhigh) scores 46 on the Intelligence Index. Different harnesses, task sets, and costs sit behind the two numbers, and cheaper configurations score higher on both charts.

On the September 22, 2026 Intelligence Index snapshot, Xiaomi’s open-weights flagship scores within a point of GPT-5.6 Sol and Grok 4.7 at less than a tenth of their cost per task. Its cybersecurity lead is on one kind of task, measured by Xiaomi.
Nine researchers held one coding-agent loop fixed and toggled planning, tools, and context management across 176 settings. Each component helped only under named conditions.
UC Berkeley and Arena researchers ran 21 model and harness pairs on two public suites. Success stayed close across harnesses; cost did not.
Specific Labs licensed private production codebases and scored eight model-and-harness pairs over 640 rollouts. The leading 38.8% is an aggregate that per-task results reorder.

Cognition’s 39% is one comparison: an Astra-led Fusion pair against Codex on the Artificial Analysis index, at a lower score. The same post’s other reported savings run from 11% to 46%.
Scientists accepted 70 of 920 proposed workflows. The leading configuration resolved 30 percent; cost and token frontiers show why that rate is incomplete.
French-Owen reports about $0.10 per run versus about $1 with earlier Sonnet-class models, from one person’s experiment.

Dan Luu’s FRE loop won a public regex suite and then failed a holdout. A high coding-agent score still needs cases the optimizer could not see.

SemiAnalysis’s faster catch-up describes era composites. Closed configurations still lead AA Index in this coding-agent snapshot.

The checked snapshot keeps a configuration on the frontier only when nothing cheaper scores at least as well on AA Index.
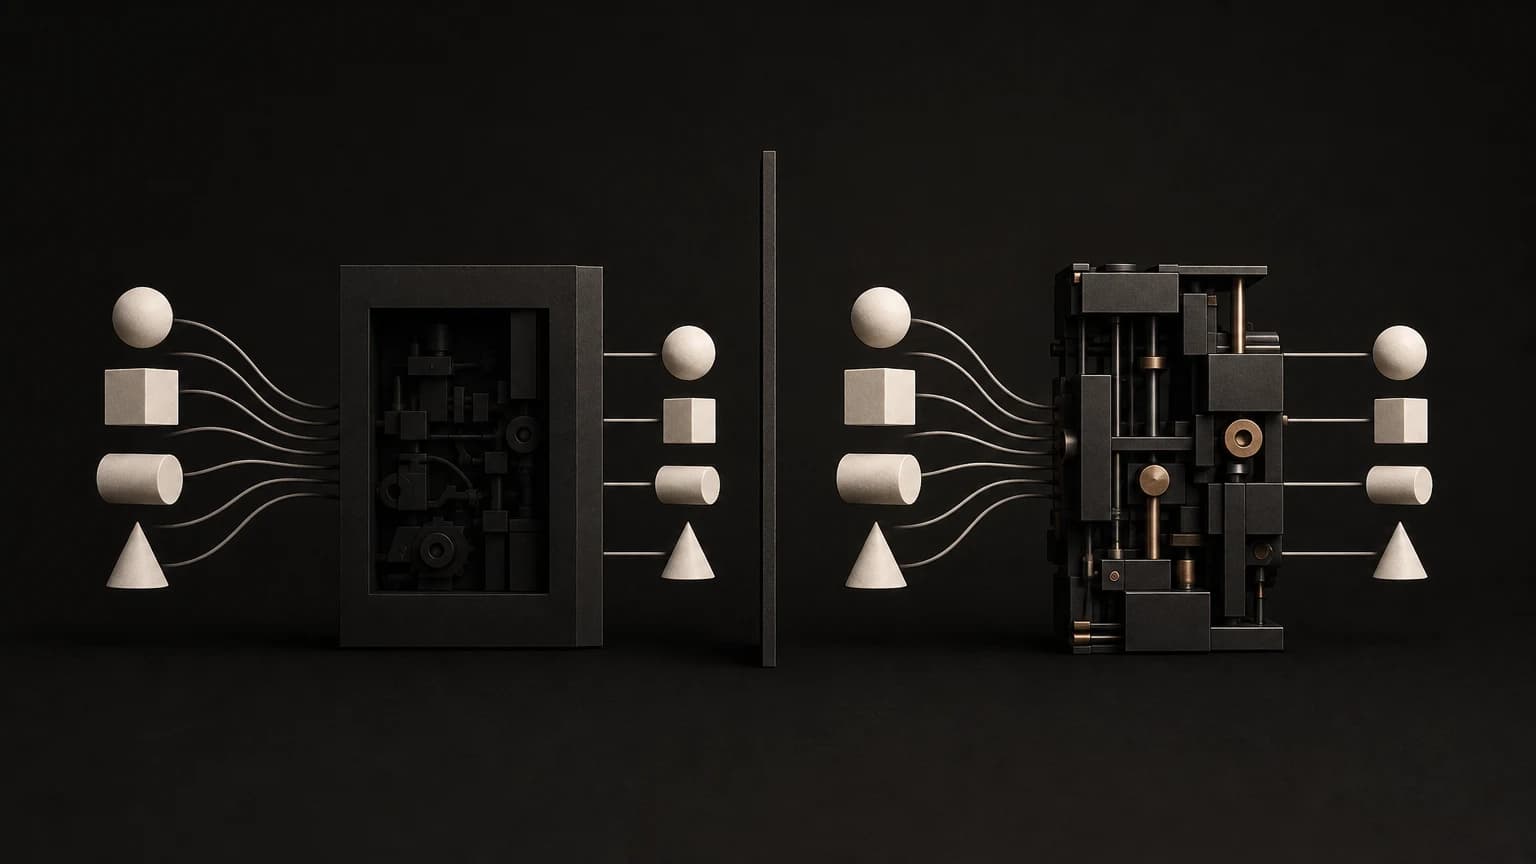
Epoch AI and METR hide the original source and grade a replacement on held-out tests under project-scale budgets.
Each note starts with primary or first-party evidence. Material claims link directly to those sources.
Leaderboard values are paired with their observation date and named configuration. They can change after publication.
Methodology limits and interpretation are kept near the results they qualify. Benchmark performance is not treated as a general production claim.